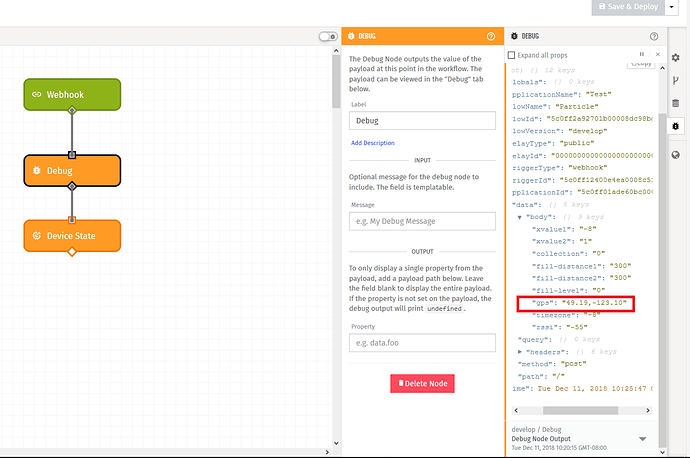
I send my GPS data in the following format: 49.19,-123.10
which is webhooked correctly by Losant (as evident in the image below)
But when I go into Data Explorer, the GPS data only shows up in the Aggregate tab, and not in the All Data (Table) tab. As a result, I`m unable to visualize my data onto a map.
Any ideas?
This is probably due to you having an Aggregation set on the Data Explorer configuration:
It defaults to MEAN, but since we don’t really know what it means to “average” a GPS coordinate, the All Data table leaves the values blank. You’ll also notice the MIN, MAX, and MEAN columns in the Aggregates table are also blank, but FIRST and LAST are populated. This is because MIN and MAX are also not defined concepts for gps coordinates. The FIRST and LAST are simply the first reported gps coordinate and the last reported gps coordinate for each time window, which we do know, so we display them.
The likley solution is to change the Aggregation drop down to NONE.
1 Like
Thanks, that makes total sense and * facepalm * for me. I didn’t notice that it defaults to “MEAN”.
My data looks great now 
Awesome! Glad we got it figured out.


