Hi guys,
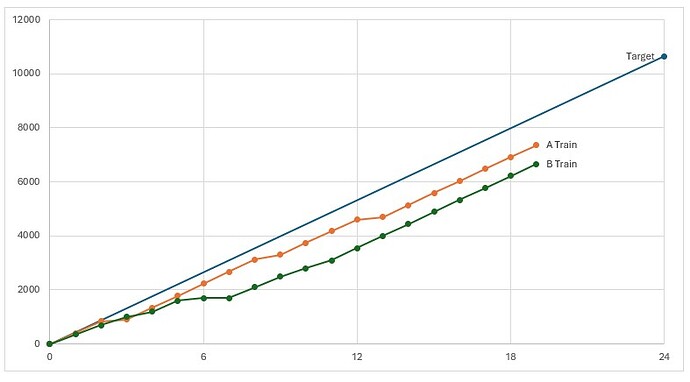
Started building out a experience to have a live trailing graph. It’s to refresh daily. I’m looking to get the daily values in the current day every hour from 0600 (0 value on the graph) to 0600 (24 value on the graph). This is so we can live track against a daily target. My idea was to loop through hourly aggregated data, and have conditionals against it to map it on the chart. However this doesn’t seem ideal.
Would you have any suggestions on how to approach this better?
Cheers,
Park
My idea was to loop through hourly aggregated data, and have conditionals against it to map it on the chart. However this doesn’t seem ideal.
What about this approach doesn’t seem ideal? Generally what you’re describing is what I would recommend, though I guess I need to know more details about how you are returning this data to be sure.
So in general, I would do the following, returning the data in response to an experience endpoint request …
- Given the current time, use a Date/Time Node to get the timestamp of the next upcoming end time (the next 6am).
- Use a Data: Time Series Node, use the “Custom” option in the “Time Range” dropdown.
- Set the “Range End” to that upcoming timestamp you fetched.
- Set the “Range Duration” to 24 hours (or,
86400000).
- Set the “Resolution” to “60 minutes”.
- Choose an appropriate aggregation method (this one depends on your use case and how data is being reported from your devices).
- Also, of course, choose the device(s) and attribute(s) whose data you need to return.
- I would do the cumulative addition of each resolution bucket in your user interface (if necessary; again, I don’t know how your data is being reported). Or perhaps your graphing library of choice can do this automatically for you.
As for your “Target” line, is that a static rate that you could code directly into your UI as a segment, or does that change conditionally?

