Hello good morning, I am contacting you to report a problem when sending screenshots of a dashboard using Chart.js.
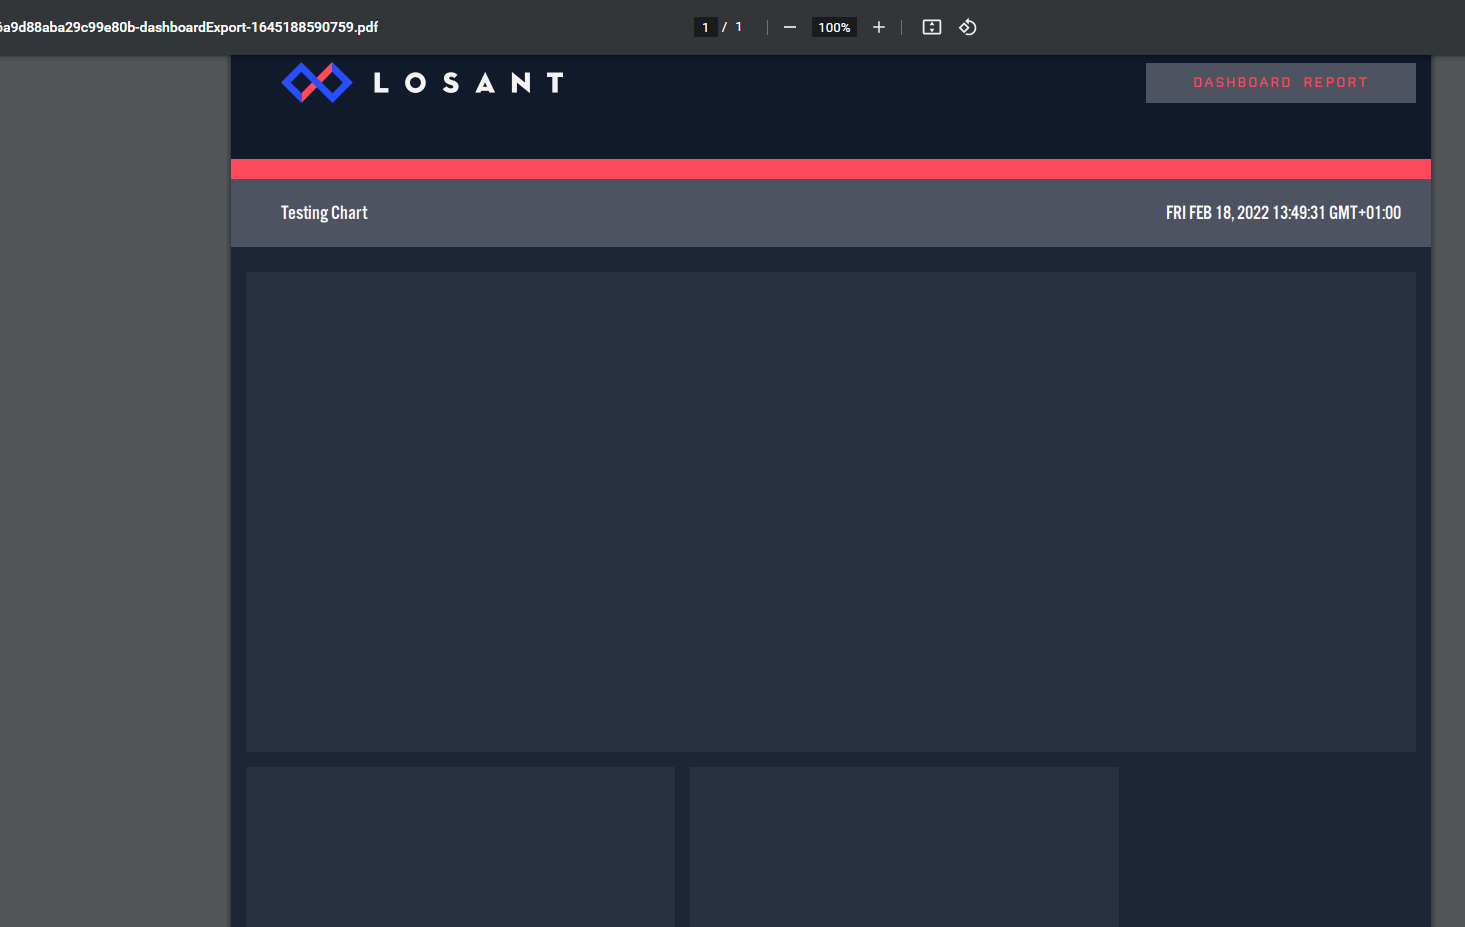
My dashboard, as you can see below, is made up of three test charts contained in three Custom HTML blocks where the corresponding code goes. The first of them, formed by a red line, as soon as it has finished loading, it becomes a static image. The other two have the Chart.js functionalities (the mouse is placed on a point and loads the data dynamically).
The blocks where the graphs should be placed are empty. It seems that what the Send Report action does is an instant dashboard capture without waiting for the javascript of my HTML blocks to be executed, preventing the loading of the charts in Chart.js.
For this particular project it is not essential to use charts in Chart.js, but it is essential to show the specific data of each point in a chart. My problem is that the charts offered by Losant are not configurable, they don’t allow to modify aspects like the one I’m talking about, to show each data in each point, so using them is not an option either.
I would like firstly to report this problem, and secondly to see if there is any option to correct it, otherwise I will have to look for a workaround to be able to take screenshots of a dashboard.
We’ve tested the report generation with other third-party libraries, such as Google Charts and Vega, and found that the charts did generate correctly. I do not know if we’ve tried Chart.js; I will look into this further and get back to you. There may be an option that must be passed in to the Chart.js instantiator to enable print-friendly generation.
Below is a simple example illustrating how you can do both. Note that we are storing blockWidth and blockHeight as global variables, setting their values off of the DashboardBlock.resize event. We are also calling the chart’s resize and manually setting the width and height from those values in the beforeprint event.
Hi Dylan, thank you very much for your quick response. Thanks also for investigating if there was a solution, as I thought the problem would be in Losant and not in the code related to Chart.js.