How can I query timeseries data in a way that covers all durations and resolutions using the Custom HTML block?
Would there be any way to parameterize the duration and resolution of the queries to avoid multiple queries in the Custom HTML block?
I did some tests combining 8 queries per attribute to cover all resolutions and durations, but I realized that it will not be scalable for a dashboard page with multiple blocks with multiplus attributes. This solution can also cause high consumption of the platform’s resources.
I checked the possibility of using an API flame passing the query parameters, however it was not feasible to use this solution.
Would you be able to tell me more about your use case and what you are hoping to implement? I want to be sure I answer your question in the best way possible.
Are you looking to get all data points for all durations and resolutions or are you looking to get all time series data for a device between a start and end point?
Any additional context you can provide would be very helpful.
Basically I need to develop a graph with the same characteristics as the “Edit Time Series Graph” block, but using the Custom HTML block. The graph I need to develop has some more features and features compared to the graphs available in the “Edit Time Series Graph” block.
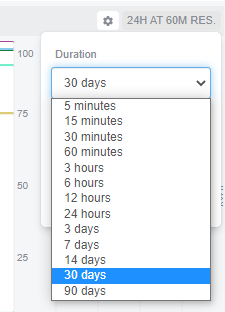
In this graph I’m developing, I need to keep the same options for duration and resolution that exist in the standard blocks of the platform.
@lucasbtsuchiya I’d be interested to hear what features you’ll be implementing, as it may inspire some changes in our existing time series graph.
As for your case, I can think of two workarounds for how to retrieve data for the block, but both of them would require you to …
Build the duration / resolution selectors into your custom HTML block. If you’re interested in pursuing these, let me know and I can provide some code to get you started.
Do the data fetching from custom code you write within the custom HTML block (i.e. using the fetch API or jQuery.ajax).
As to how to get the data, you could …
Make a request to a webhook or experience endpoint from within the block. The request would then fire a workflow that, given a duration and resolution provided by the user, would use the Data: Time Series Node or the Losant API Node to build the data in the format of your choosing and reply to the request. Depending on how you plan to use this dashboard (public, internal use, or in an experience page), you can add some level of authorization to the endpoint/webhook as well.
Build a separate time series graph in a different dashboard within your organization, and to that graph add all the segments (devices / attributes) you would like to use in your custom HTML block. Then, you can use the private endpoint that fetches data for the time series graph within your custom HTML block, which would also allow you to submit the request with custom durations and resolutions.
Note, this is not a public endpoint, meaning that while we have no plans to deprecate it or to issue a breaking change to it, we do not guarantee that that will not happen in the future.
Also, this method will not work if you are serving the custom HTML block as part of an experience page, unless the time series graph is in the same dashboard as the custom HTML block.
Let me know if this helps and if you have any other questions.