I’m trying to use the time series node to collect data from a device over a custom time range. I have the aggregation set to ‘sum’ and the resolution set to 24 hours. From what I can tell using this resolution defaults the 24 hour summation period from midnight to midnight GMT. Is there any way to manipulate this query such that the summation of data for a 24 hour period is aligned with the local timezone? I had tried setting the ‘range end’ to midnight local time but didn’t seem to work either.
There is currently not a way to change the bucket windows. As you noticed, they are currently based on GMT. I’ve added a ticket for us to investigate ways to support more custom bucket times.
Thanks for the update Brandon, essentially we build reports for our users by exporting the data to a TP api which builds the reports. We have a clunky workaround at the moment which isn’t ideal. Being able to apply custom bucket times before we export the data would be a huge help. I guess the workaround for the time being would be to loop over a 24 hour period with n= number of days? Any other suggestions would be much appreciated.
Hi! I need your help please… … how can I graph the current value and the average of the last 10 readings at the same time? Tks a lot!
One way to accomplish this is to use the Losant API node within a workflow, and add an attribute to a device to store the average.
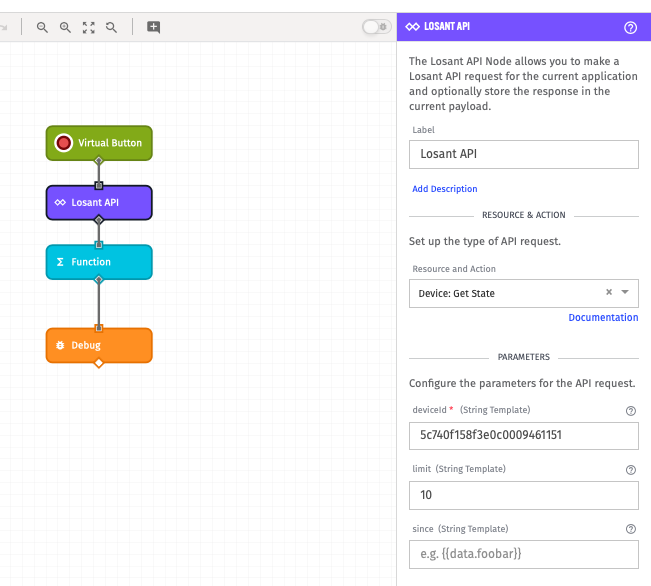
First, add an attribute to your device to hold the average value. Then within your workflow you can use the Losant API node to get the last ten state values of a device.
Loop through those values and average them, then set that averaged value to your new device attribute.

You will then be able to compare and graph the two values simultaneously.
Hopefully this helps!
Julia
Thanks for your support Julia!, the proposed solution works perfectly.
Hi Julia, I have a question: what is the limit of the Losant API? Can I include 1000 as a parameter?
There is not a number limit on past states for Device: Get State in the Losant API node; you can set the limit to 1000. Note that as the limit value gets larger, you may run into some runtime issues with your workflows.
Thanks!
Julia
Hi @Brandon_Cannaday,
Bouncing back on @rwild_node’s issue, I’m in the same situation as I’m trying to sum data for one day only, local time.
Any update since 2018?
Can you clarify what you mean by “one day only”?
Are you just trying to get a single data point, which is the sum of all points collected over a 24 hour period (in local time)?
Correct, I’m trying to get a single data point, collected from midnight to midnight, local time.
For a single data point, you can use the Date/Time Node, which is new since this topic was originally created, to find “midnight” for any Timezone:

- Leaving the
Source Pathfield blank defaults to the current time, or “now”. - Use the
Start of Timeoperation to set theDayunit to zero for the selected Timezone.
This results in a Date object being added to the payload that represents 00:00:00 for the current day, or “midnight”. You can follow this with another Date/Time Node to subtract one day if you want midnight to midnight for the previous day.
Then in the Data: Gauge Query Node, use that date as the Range End and set the duration to 24 hours (in milliseconds).

The {{formatDate working.midnight 'x'}} helper converts the date object to a Unix timestamp (milliseconds since epoch).
Thanks @Brandon_Cannaday,
Sorry I haven’t given you enough details.
I have 3 attributes, each attribute is a counter that counts during its own shift (morning, afternoon, overnight). I have used a similar method to yours to populate each attribute.
Now, I want to put these three attributes on a graph and show the value for each day using a resolution of 24hrs.
Problem is a 24hrs period starts at 1PM local time. My d-day morning shift shows up at d-1.
I understand now. The Time Series resolution still buckets on GMT, so no changes there. I suppose in your case you could query each day individually using the method above using a Loop Node. You would not be able to use our built in dashboard tools to display it, but it could be displayed in a custom experience using a third-party charting library.