Trying to get the custom html table to work as described to show a table from a data table, but I’m not having any luck.
What does the data table look like that is referenced in the documentation example?
Just a “time” and “value” field?
There are two ways for you to discover what this data looks like:
First, if you add this snippet within a <script> tag, you can see the data format.
$(document).ready(function() {
    console.log(DashboardBlock.input);
});
This will print that entire object into Chrome Dev Tools, where you can inspect the data.
Secondly, If you create a second block with the exact same input, you can see the data format in the block preview:

I can see the data in the block preview.
What I’m not clear on is the statement in the loop design starting at .
input.queries.cost.forEach(function(point) {
does “point” need to be replaced with one of my column names or stay as “point”
I just want to see the fields called “start” which is a date string, and “machine” which is a Number.
If you’re following this example:
It’s pulling from a Time-series query, you will need to rewrite the Javascript to loop through the Data Table Query and add those values to the table.
Here are some great resource to help you write the Javascript:
I get that I need to change the Javascript to handle the data datble query instead of a time series query, I just can’t find a good example of how that is done.
I’ve created this example for you:
To test this out, you can use import this as an example Data Table:
warnings_and_alarms.csv (4.3 KB)
Then, while configuring the block,

In the screenshot above, notice that the “Query Name” is warnings.
Here is the head content:
<link
  rel="stylesheet"
  href="https://stackpath.bootstrapcdn.com/bootstrap/4.3.1/css/bootstrap.min.css"
/>
<script src="https://code.jquery.com/jquery-3.3.1.slim.min.js"></script>
<script src="https://cdnjs.cloudflare.com/ajax/libs/popper.js/1.14.7/umd/popper.min.js"></script>
<script src="https://stackpath.bootstrapcdn.com/bootstrap/4.3.1/js/bootstrap.min.js"></script>
<script src="https://cdnjs.cloudflare.com/ajax/libs/moment.js/2.24.0/moment.min.js"></script>
<style>
  body {
    padding: 10px;
    margin: 0px;
    background: transparent;
  }
</style>
<script type="text/javascript">
  function renderBlock(input) {

    if (DashboardBlock.input.queries.warnings) { // check ot see if the query was successfull
      $('#table-body').empty() // empty table on re-render
      // loop through each point and append row to table
      input.queries.warnings.items.forEach(function(row) {
        $('#table-body').append(`
              <tr>
              <td>${row.warning_or_alarm ? 'Alarm': 'Warning'}</td>
              <td>${row.description}</td>
              </tr>
          `)
      })
    }
  }

  DashboardBlock.on('queryChange', renderBlock)
</script>
To access that data, we can use DashboardBlock.input.queries.warnings. You configured the key warnings in the query above.
Then, we can access each row like so row.description.
Here is the body content:
<div class="container-fluid">
  <table id="table" class="table table-dark">
    <thead>
      <tr>
        <th scope="col">Type</th>
        <th scope="col">Description</th>
      </tr>
    </thead>
    <tbody id="table-body"></tbody>
  </table>
</div>
Here is the desired result:

As you can see, this example isn’t too different from the others, It all depends on how you’re referencing and accessing the queries and its data.
Let me know if this helps 
Thanks. I’m all good now.
When creating the query from a data table as above, is there a way to sort the returned rows?
Hi @Lars_Andersson,
This functionality is not currently supported when querying, so sorting would have to be done after fetching the rows. However, I am creating a Feature Request for this as it would be a valuable addition to the block. I will update you should this be implemented in the near future!
Thanks,
Julia
Hi @anaptfox, along the same lines as this query. I am using the custom HTML block to render a table. I notice it will only return 1000 lines of that table, is there a way to either extend this, or a way to filter to the last 3days worth of data?
Hi @Josh_Bell!
I’ve dug into this, and it looks like the query limit for that block is 1000 lines. That limit is being imposed by the query section, not the HTML.
I’m following up with our team to see what the next best steps are for this and will follow up when I have an answer.
Hi @Heath_Blandford1 is there a way I can make the table build from the top down instead? I wouldn’t mind the 1000line limit if it gave me the most recent 1000 rather than the 1st 1000.
Josh Bell
Hey @Josh_Bell,
Unfortunately, there isn’t a way to sort dashboard table queries in the Custom HTML block. I have created a Feature Request for sorting queries. I will update you should this be implemented in the near future!
What type of the three dataset queries are you using for your Custom HTML block?
Thanks!
Heath
Oh, great!
Have you considered using a Data Table block?
This option isn’t as customizable as a Custom HTML block, but it will show all the rows of the selected Data Table with 1,000 rows per page. You can sort ascending/descending updatedAt and createdAt by default, as well as any other column you may have. Although, you can only sort ascending/descending on the block itself, you can query the table in the block configuration to return a subset of your table’s rows.
As I mentioned before, I have created a Feature Request for sorting queries, and will update this thread should it be implemented.
Thanks,
Heath
@Heath
Yes I started out using that block but unfortunately you cant seem to customize which columns are displayed meaning you get the annoying default “id”, “createdAt” and “updatedAt” columns displayed. I moved to the custom HTML block to get around this.
@Heath
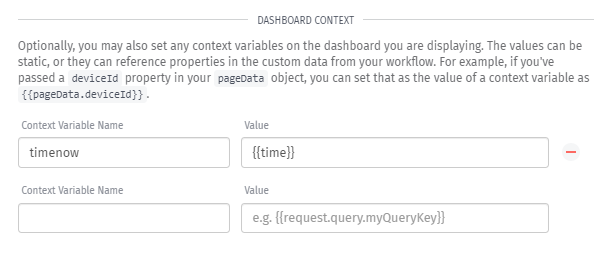
I thought i might be able to do this in my experience page by passing the current time using a context variable then doing some math on it to subtract time, however this doesn’t seem to be working. I have created the number variable {{ctx.timenow}} and have set this to {{time}} on my experience page, but it doesn’t seem to pass through:


to test if the time is being passed through I referenced it in the block title:

but when i render the experience page it stays at the default value:

Is there a reason this isn’t working as i thought it might?
thanks
Hey @Josh_Bell,
In the Dashboard Context configuration on the Page settings, you can use the formatDate Format Helper.


Let me know if you have any more questions!
Heath
thanks, not quite what i was looking for but I solved it myself anyway. I created an experience workflow to specifically pass the time/date back as a {{pageData}} object for that page, so i used that workflow to format the date, subtract 31days off it then pass it back to the ctx variable. I then use a filter on the dashboard block to only give me data greater than my ctx variable, this means I don’t hit the 1000line limit, convoluted but it works.